
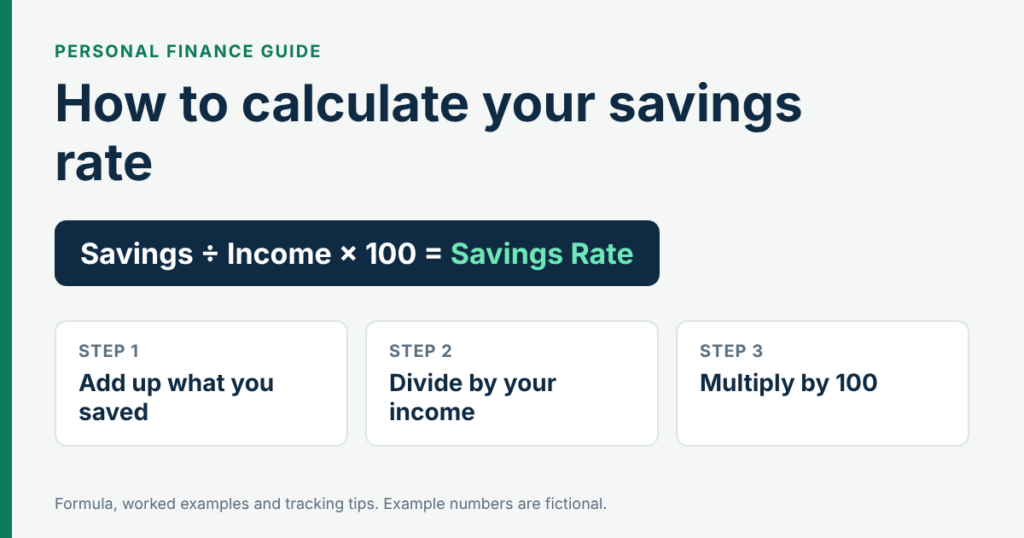
What Is a Personal Savings Rate?
A personal savings rate measures what portion of a defined amount of income you save over a defined period. If you take home $4,000 in a month and set aside $600, your savings rate is 15% of that income.
The income definition matters because the same $600 looks different against different denominators. Against $5,200 of pre-tax pay it is a smaller share than against $4,000 of take-home pay. The rate only means something when you say which income you used and keep using it.
It helps to separate the savings rate from four ideas that sound similar:
- Savings account interest rate. This is what a bank pays on your balance. It says nothing about how much of your paycheck you save.
- Total savings balance. A balance is a stock of money built over years. A savings rate describes the flow into it during one period.
- Investment return. Gains or losses on invested money are not savings you contributed, so they are normally kept out of the calculation.
- Emergency fund size. An emergency fund is a goal for a balance. Contributions to it can count as savings, but the fund itself is not the rate.
How to Calculate Savings Rate
The basic formula is:
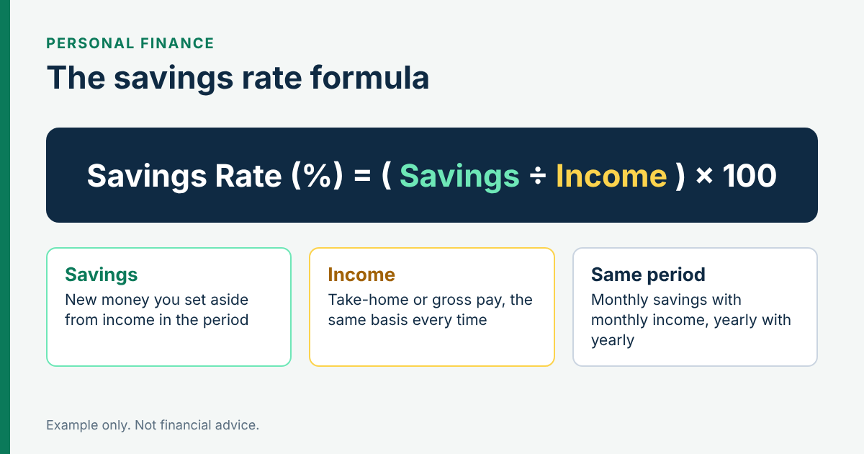
Here is a worked example. Suppose your monthly take-home income is $4,000, and during the month you move $350 into an emergency fund and $250 into a Roth IRA.
- Total savings: $350 + $250 = $600
- Divide by income: $600 ÷ $4,000 = 0.15
- Multiply by 100: 0.15 × 100 = 15%
Your savings rate for the month is 15%. This example counts only money you chose to set aside from income you received. Later sections explain how to treat retirement plan contributions and other borderline items.

Each part of the formula has a job, and mistakes usually come from one of them being defined loosely.
- Savings amount. New money you set aside from income during the period, using a definition you write down and keep.
- Income amount. The income measure you chose, such as take-home pay or gross pay. It should be the same measure every time.
- Time period. A week, month, quarter, or year. Savings and income must both come from that same window.
- Percentage conversion. Dividing gives a decimal. Multiplying by 100 turns 0.15 into 15%.
If your income changes from month to month, a single month can mislead. A freelancer who earns $2,900 one month and $5,100 the next will see the rate swing even if their habits stay the same. For irregular earners, adding up several months of savings and dividing by the same months of income usually gives a steadier picture. The monthly and annual examples below show how.
Whatever you decide, keep it consistent. A rate calculated on take-home pay in March and on gross pay in April cannot be compared, even though both are legitimate numbers.
Gross Income vs. Take-Home Pay: Which Should You Use?
Gross income is what you earn before taxes and payroll deductions. Take-home pay, also called net or after-tax income, is what lands in your account after those deductions. Both are reasonable denominators, and neither is the single correct one.
Some people prefer take-home pay because it reflects the money they can actually decide to spend or save. Others prefer gross income because it captures the full size of their earnings and makes it easier to count payroll retirement contributions. Using one or the other is a budgeting convention, not an official rule.
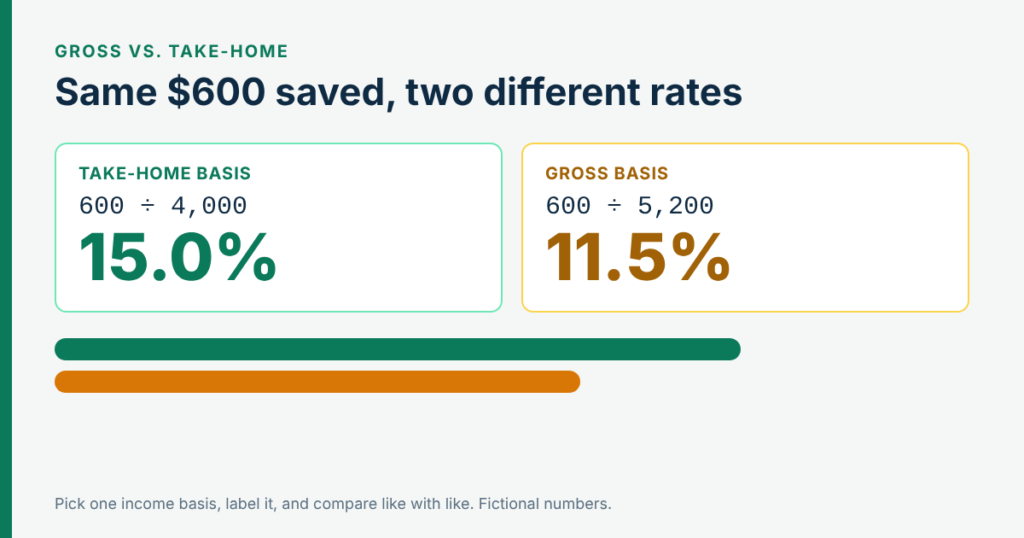
The choice changes the result. Take a person with $5,200 of gross monthly pay, $1,200 of taxes and payroll deductions, and $600 of savings.
Income basis | Income | Savings | Savings rate |
Take-home pay | $4,000 | $600 | 15.0% |
Gross pay | $5,200 | $600 | 11.5% |
The saving behavior is identical. Only the denominator changed, which is why you should label the method (for example, “15% of take-home pay”) and compare like with like. This is also a reason to be careful when comparing your figure with a friend’s or an article’s: ask which income they used first.
How to Calculate Monthly Savings Rate
Start with a monthly calculation; it matches how most people are paid and billed.
- Pick the monthly income figure. Use take-home pay or gross pay, and note which one.
- Total what you saved that month. Add deposits to savings accounts, contributions to retirement or investment accounts, and money set aside for a planned expense.
- Decide how to treat payroll retirement contributions. If they come out of your paycheck before it reaches you, either leave them out of both numbers or add them to both.
- Divide savings by income.
- Multiply by 100.
- Record the result and compare it with earlier months.
Here is an example of step 3. Your take-home pay is $4,000 after a $200 401(k) deduction, and you transfer $400 to a savings account.
- Cash-only method: $400 ÷ $4,000 = 10%
- Including the payroll contribution: ($400 + $200) ÷ ($4,000 + $200) = $600 ÷ $4,200 = about 14.3%
Both are valid. The second adds the $200 to savings and to income because that money was part of your earnings before it was redirected. Mixing the two, for example adding $200 to savings but not to income, would overstate the rate.
Irregular income, bonuses, and unusual months
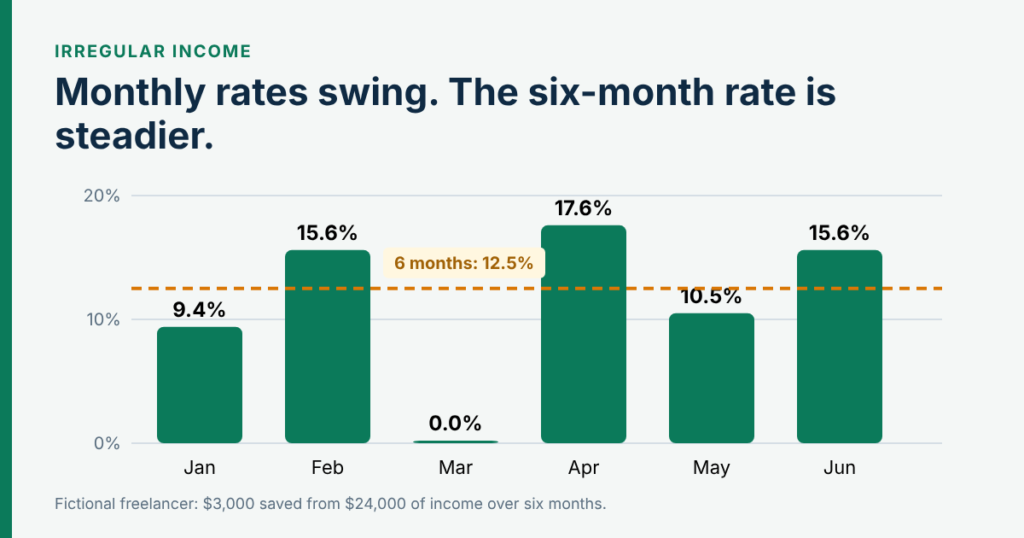
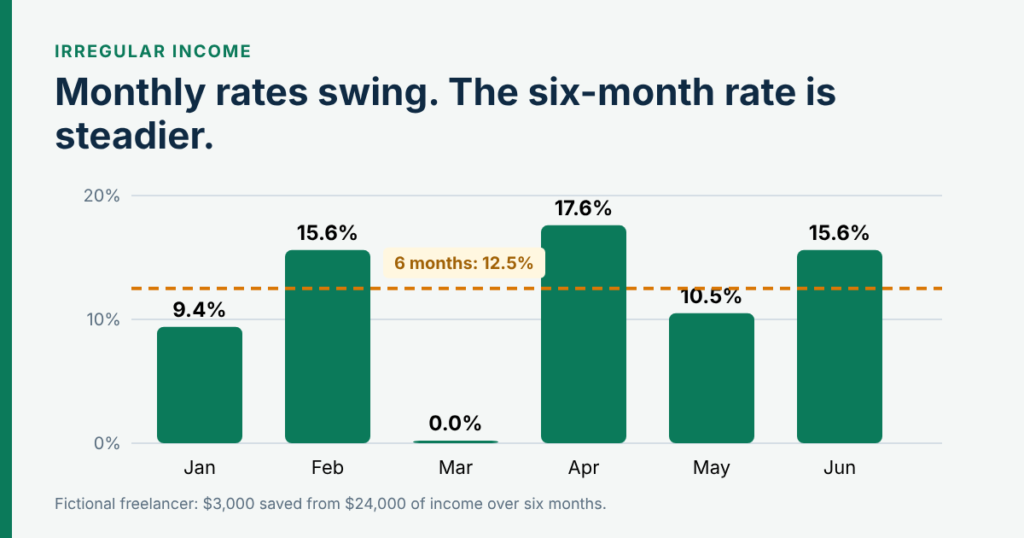
If your pay varies, calculate each month but also look at several months together. In this example, a freelancer tracks six months:
Month | Income | Savings | Savings rate |
January | $3,200 | $300 | 9.4% |
February | $4,500 | $700 | 15.6% |
March | $2,900 | $0 | 0.0% |
April | $5,100 | $900 | 17.6% |
May | $3,800 | $400 | 10.5% |
June | $4,500 | $700 | 15.6% |
Six-month total | $24,000 | $3,000 | 12.5% |
The monthly figures range from 0% to 17.6%, but the six-month rate is $3,000 ÷ $24,000 = 12.5%. That better rvwwzalcrr this person’s habits. Notice that the total is not the simple average of the monthly percentages, because larger months carry more weight.
For a bonus, include it in income for the month you receive it, or track it separately if you want to see how much of it you saved. For a month with an unusual expense, such as a car repair, resist the urge to skip it. Looking at a longer window smooths the effect without hiding it.
How to Calculate Annual Savings Rate
An annual calculation uses a full year of savings and a full year of income, both defined the same way. Suppose your take-home pay is $48,000 for the year and you also receive a $3,000 after-tax bonus, for $51,000 of income. Across the year you save $8,700.
- Total income: $48,000 + $3,000 = $51,000
- Total savings: $8,700
- Divide: $8,700 ÷ $51,000 = 0.1706
- Multiply by 100: about 17.1%
The key rule is matching periods. Dividing $8,700 of yearly savings by $4,000 of monthly income would produce nonsense, and so would dividing one month’s $600 by $48,000 of annual income, which gives 1.25% instead of the true 15%.
Annual tracking is especially useful when income or expenses come in lumps. Property taxes, insurance premiums, holiday spending, tax refunds, and seasonal work can all distort a single month. A yearly figure absorbs those swings and shows the direction of travel.
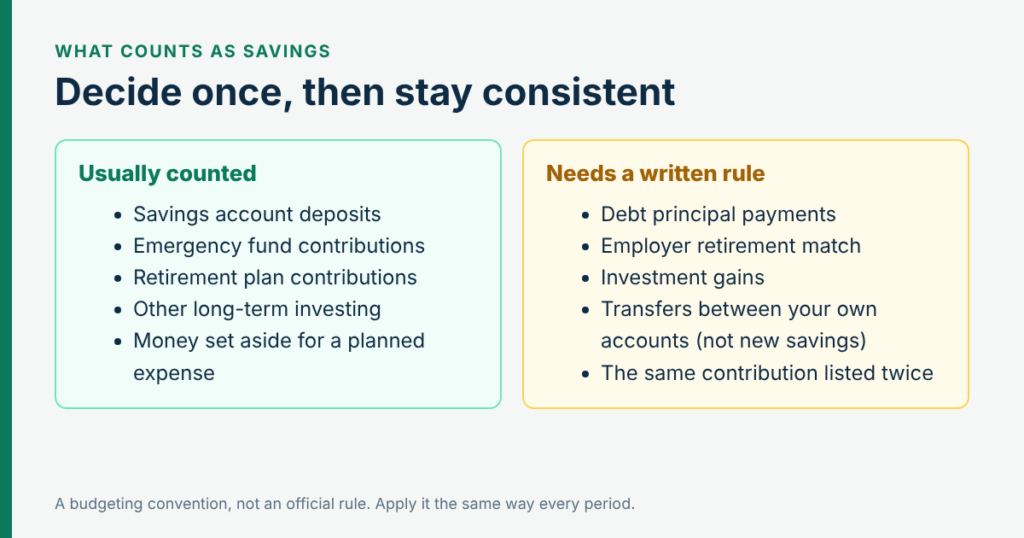
What Counts as Savings?
There is no single legal definition for a household budget, so the goal is a definition you can explain and apply the same way every period. These are the categories most people consider:
- Deposits into savings accounts.
- Contributions to an emergency fund.
- Contributions to retirement accounts, including payroll deductions.
- Contributions to other investments meant for long-term goals.
- Money set aside for a defined future expense, such as an annual insurance premium or a planned repair.
Some items need extra care:
- Transfers between accounts. Moving $500 from savings to a brokerage account is not new savings. Count money when it first leaves your income, not each time it moves.
- Double counting. If your paycheck sends $200 to a 401(k) and you also list that $200 as a monthly investment, you have counted it twice.
- Debt principal payments. Paying down a loan reduces what you owe, but whether to count it is a choice. Decide once and write it down. Minimum required payments are usually treated as expenses.
- Employer retirement contributions. An employer match is not part of your paycheck. You can leave it out, or add it to both savings and income.
- Investment gains. Growth on money you already have is a return, not a contribution from this period’s income.
What Is a Good Savings Rate?
There is no single percentage that is right for everyone. A reasonable target depends on your circumstances, and it can change as they do. Factors that matter include:
- Your income and how much of it goes to housing and other essentials.
- High-interest debt you are paying off.
- Dependents and family responsibilities.
- How much emergency savings you already have.
- How far you are from retirement and what you want it to look like.
- Your job stability and how much your income varies.
One widely used budgeting guideline is the 50/30/20 framework. In its common form, about 50% of after-tax income goes to needs, 30% to wants, and 20% to savings and extra debt payments. Treat it as a starting point for conversation with yourself, not a rule. Someone with high housing costs or dependents may find it unrealistic, and someone with a large income and low expenses may be able to save much more.
A savings rate also does not guarantee a result. Saving 15% or 20% does not ensure a comfortable retirement, because outcomes depend on how long you save, what you invest in, inflation, taxes, and events no one can predict.
Your rate versus the national saving rate
The U.S. Bureau of Economic Analysis publishes a national figure called the personal saving rate, defined as personal saving as a percentage of disposable personal income. In its Personal Income and Outlays release for August 2026, published September 30, 2026, BEA reported a personal saving rate of 4.1 percent, with disposable personal income defined as personal income less personal current taxes.
That number is an economy-wide statistic built from national accounts, and BEA updates it monthly. It is not the same as your household budgeting ratio, which depends on the definitions you choose. Comparing your 15% to a national 4.1% says little, because the two are measured differently and describe different groups. Use the national figure as background, not as a target.
Common Savings Rate Calculation Mistakes
|
Mistake |
Why it distorts the result |
Practical fix |
|
Mixing gross income and take-home pay |
The denominator changes, so months are not comparable |
Choose one basis and label every result |
|
Comparing monthly savings with annual income |
The periods do not match, so the rate looks far too low |
Use matching windows, such as $600 against $4,000 |
|
Counting transfers between accounts as new savings |
Money is counted again each time it moves |
Count it once, when it first leaves your income |
|
Counting the same contribution twice |
Savings are overstated |
Check payroll deductions against your own transfer list |
|
Ignoring irregular income |
One strong or weak month misleads |
Use a three-month, six-month, or annual window |
|
Changing the method without a note |
Trends become meaningless |
Record any change and the date it started |
|
Confusing account interest rates with savings rates |
One is a price paid by a bank, the other is your behavior |
Keep them separate in your notes |
|
Comparing your figure with national statistics |
Definitions and populations differ |
Compare with your own earlier results instead |
A related slip is mixing up percentage points and percentage changes. Moving from 10% to 15% is a 5 percentage-point increase in your savings rate, which is a 50% increase in the share you save. Both statements are correct, but they mean different things.

How to Increase Your Personal Savings Rate
The best approach depends on your income, expenses, and obligations. Some people can trim spending; others will get further by raising income or paying down expensive debt. If saving feels hard, that usually reflects real constraints, not a lack of discipline. Start with the steps that fit your life.
- Track your spending. A month of records shows where money goes before you decide what to change.
- Automate transfers. Moving money to savings right after payday means you save before you spend. Many people try this approach when working out how to save money from a monthly salary.
- Review recurring charges. Subscriptions, memberships, and automatic renewals can add up and are easy to cancel if unused.
- Set a realistic emergency fund goal. The Consumer Financial Protection Bureau’s guide to building an emergency fund notes that the right amount depends on your situation and suggests looking at the unexpected costs you have faced before. It also says even a small amount can help.
- Reduce avoidable expenses. Look for costs you would not miss, but avoid cutting essentials such as food, health care, or insurance in ways that backfire later.
- Raise income where feasible. Negotiating pay, taking on extra work, or building skills can increase what you are able to save.
- Manage high-interest debt. Paying down expensive balances can free up cash. Decide whether to count extra principal payments as savings, and stay consistent.
- Review your goals regularly. A yearly check keeps targets aligned with changes in income, family, and plans.
- Increase savings gradually after a raise. If take-home pay rises by $200 a month and you add $100 to savings, your rate moves from 15% to ($600 + $100) ÷ ($4,000 + $200) = about 16.7%, and you still enjoy part of the raise.
- Avoid extreme cuts. A plan you cannot sustain tends to end in a rebound. Small, steady changes usually last longer.

How to Track Your Savings Rate
Tracking turns a one-time calculation into a habit. Any of these methods works, and the best one is the one you will keep using:
- A spreadsheet. Flexible and free, with one row per month.
- A budgeting app. Useful if it can categorize savings transfers correctly and you check it regularly.
- A monthly financial review. Ten or fifteen minutes after your last paycheck of the month is enough to total income and savings.
- A simple savings rate calculator. Any basic calculator or online tool that divides savings by income gives the same answer, provided you enter the right figures.
The table below is an illustration with fictional numbers, using take-home income.
Month | Income | Savings | Savings rate |
January | $4,000 | $600 | 15.0% |
February | $4,000 | $400 | 10.0% |
March | $4,200 | $630 | 15.0% |
April | $4,000 | $800 | 20.0% |
Year to date | $16,200 | $2,430 | 15.0% |
The month-to-month numbers move between 10% and 20%, yet the year-to-date rate is a steady 15% ($2,430 ÷ $16,200). That is why consistent tracking matters more than any single month. One low result is information, not failure.
Once you know how much you save, the U.S. Securities and Exchange Commission’s Investor.gov offers a free compound interest calculator that can show how a regular amount might grow at an assumed rate. The results are hypothetical and are not a prediction.
Frequently Asked Questions
How do I calculate my savings rate?
Divide the money you saved during a period by your income for the same period, then multiply by 100. For example, $600 saved from $4,000 of take-home income is 15%.
Is a 20% savings rate good?
It can be, but it depends on your situation. Twenty percent is a common budgeting guideline, not a requirement. On $4,000 of monthly income it means saving $800. If you carry high-interest debt or have tight essential expenses, a lower rate that you can sustain may be more realistic.
Should I calculate my savings rate before or after taxes?
Either can work if you stay consistent. Take-home pay is common in personal budgets, while gross income suits people who want to count payroll deductions. For context, BEA’s national saving rate uses disposable personal income, which is income after personal current taxes.
Do retirement contributions count toward my savings rate?
Many people count their own contributions. If the money is deducted from your paycheck, add it to both your savings and your income so the ratio stays consistent. You can include or exclude employer matches, but apply the same rule every time.
How often should I calculate my savings rate?
Monthly works well for most people, with a yearly review to see the bigger picture. If your income is irregular, also look at a rolling three-month or six-month figure.
Can I have a good savings rate with a low income?
Yes. The rate is a percentage, so it applies at any income level. Saving $100 from $2,000 is 5%. When essentials take most of your pay, the dollar amount may be small, and starting small is still progress. Be realistic about what your budget allows.
What is the difference between savings rate and interest rate?
Your savings rate measures how much of your income you save. An interest rate is what a bank or lender pays or charges on a balance. You can have a high savings rate and a low interest rate, or the reverse.
How can I calculate my savings rate in Excel?
Put income in column B and savings in column C. In cell D2, enter =C2/B2 and format the cell as a percentage. This assumes B2 holds the income measure you chose and is not zero. To avoid an error, use =IF(B2=0,””,C2/B2). For a year-to-date rate, use =SUM(C2:C13)/SUM(B2:B13) rather than averaging the monthly percentages.
Conclusion
The savings rate formula is simple: Savings Rate (%) = (Savings ÷ Income) × 100. What makes it useful is consistency. Decide whether you will use take-home or gross income, write down what counts as savings, and apply the same rules every month. Look at longer windows if your pay varies, and treat any single month as one data point.
Try it with your own numbers this week. Total last month’s savings, divide by the income you chose, and record the result. Then repeat it next month. Small, steady changes usually matter more than a perfect plan, and your own trend is the best benchmark.
References
Sources opened and checked on October 21, 2026:
- S. Bureau of Economic Analysis personal saving rate: definition of the personal saving rate as personal saving as a percentage of disposable personal income.
- BEA Personal Income and Outlays, August 2026: reports an August 2026 personal saving rate of 4.1 percent and defines disposable personal income as personal income less personal current taxes.
- CFPB: An essential guide to building an emergency fund: emergency fund size depends on your situation, and even a small amount can help.
- gov compound interest calculator: a free tool for illustrating growth at an assumed rate.






Leave a Reply